Metrics
By default, controller-runtime builds a global prometheus registry and publishes a collection of performance metrics for each controller.
Enabling the Metrics
First, you will need enable the Metrics by uncommenting the following line
in the file config/default/kustomization.yaml, see:
# [METRICS] To enable the controller manager metrics service, uncomment the following line.
#- metrics_service.yaml
# [METRICS] The following patch will enable the metrics endpoint. Ensure that you also protect this endpoint.
# More info: https://book.kubebuilder.io/reference/metrics
# If you want to expose the metric endpoint of your controller-manager uncomment the following line.
#- path: manager_metrics_patch.yaml
#  target:
#    kind: Deployment
Note that projects are scaffolded by default passing the flag --metrics-bind-address=0
to the manager to ensure that metrics are disabled. See the controller-runtime
implementation
where the server creation will be skipped in this case.
Protecting the Metrics
Unprotected metrics endpoints can expose valuable data to unauthorized users, such as system performance, application behavior, and potentially confidential operational metrics. This exposure can lead to security vulnerabilities where an attacker could gain insights into the system’s operation and exploit weaknesses.
By using Network Policy
NetworkPolicy acts as a basic firewall for pods within a Kubernetes cluster, controlling traffic flow at the IP address or port level. However, it doesn’t handle authentication (authn), authorization (authz), or encryption directly like kube-rbac-proxy solution.
By exposing the metrics endpoint using HTTPS and CertManager
Integrating cert-manager with your metrics service can secure the endpoint via TLS encryption.
To modify your project setup to expose metrics using HTTPS with
the help of cert-manager, you’ll need to change the configuration of both
the Service under config/default/metrics_service.yaml and
the ServiceMonitor under config/prometheus/monitor.yaml to use a secure HTTPS port
and ensure the necessary certificate is applied.
By using Controller-Runtime new feature
Also, you might want to check the new feature added in Controller-Runtime via
the pr which can handle authentication (authn),
authorization (authz) similar to kube-rbac-proxy has been doing.
Exporting Metrics for Prometheus
Follow the steps below to export the metrics using the Prometheus Operator:
-
Install Prometheus and Prometheus Operator. We recommend using kube-prometheus in production if you don’t have your own monitoring system. If you are just experimenting, you can only install Prometheus and Prometheus Operator.
-
Uncomment the line
- ../prometheusin theconfig/default/kustomization.yaml. It creates theServiceMonitorresource which enables exporting the metrics.
# [PROMETHEUS] To enable prometheus monitor, uncomment all sections with 'PROMETHEUS'.
- ../prometheus
Note that, when you install your project in the cluster, it will create the
ServiceMonitor to export the metrics. To check the ServiceMonitor,
run kubectl get ServiceMonitor -n <project>-system. See an example:
$ kubectl get ServiceMonitor -n monitor-system
NAME                                         AGE
monitor-controller-manager-metrics-monitor   2m8s
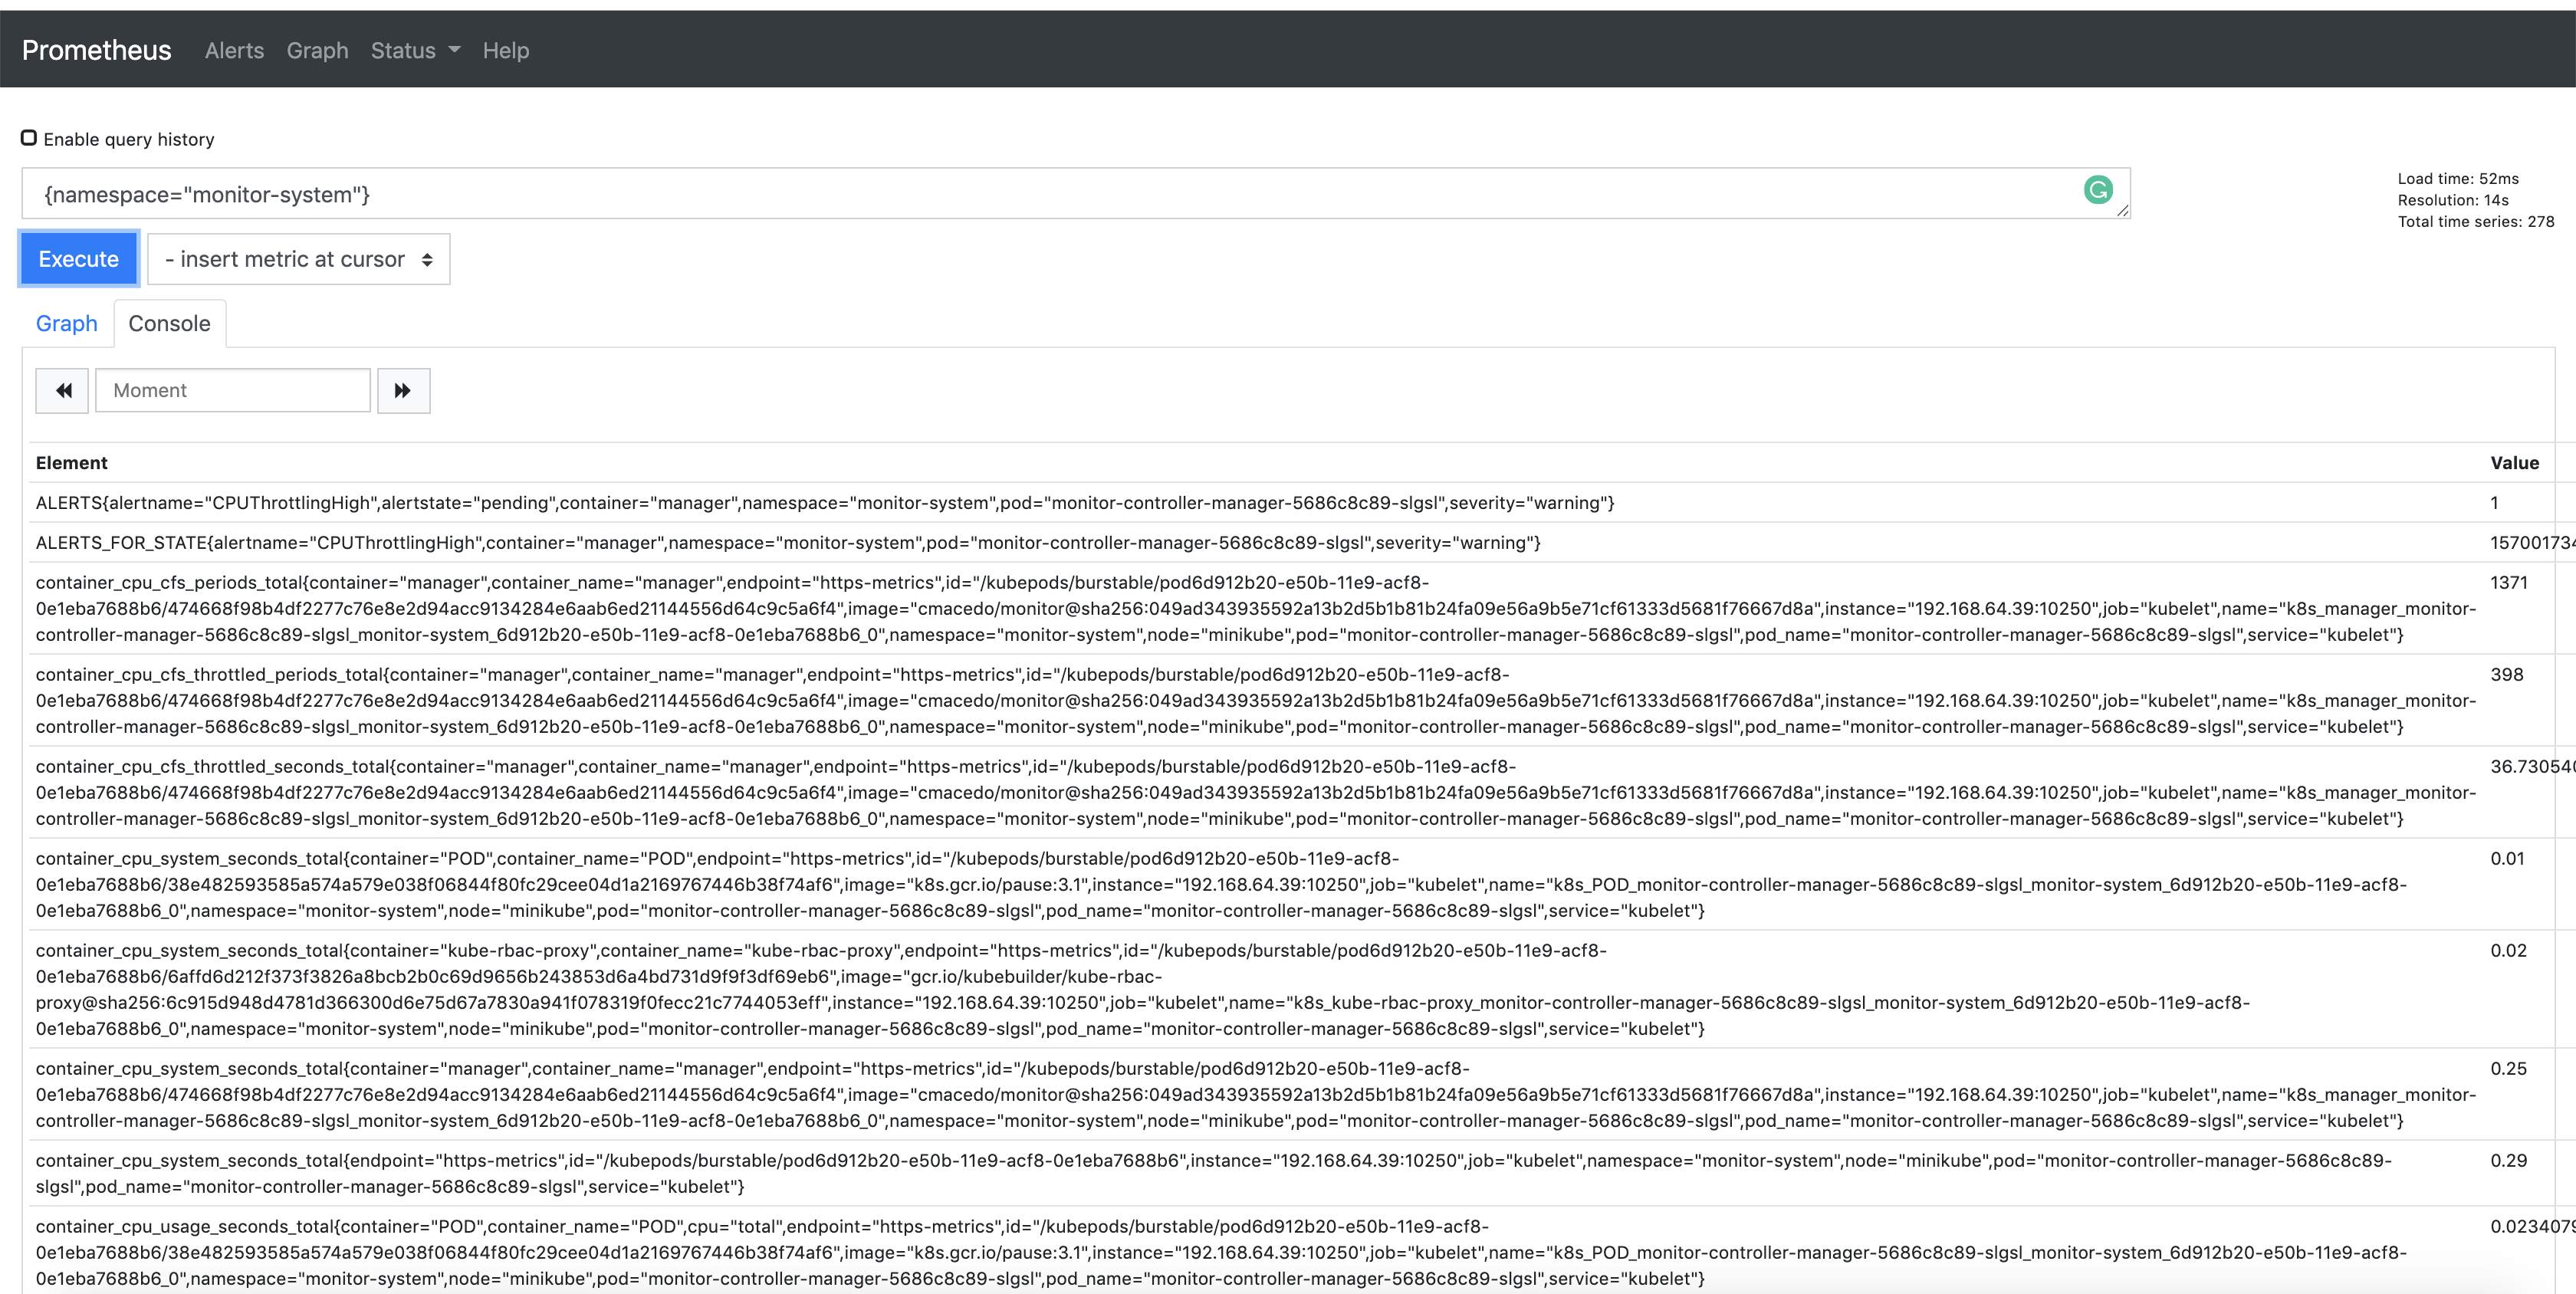
Also, notice that the metrics are exported by default through port 8443. In this way,
you are able to check the Prometheus metrics in its dashboard. To verify it, search
for the metrics exported from the namespace where the project is running
{namespace="<project>-system"}. See an example:
Consuming the Metrics from other Pods.
Then, see an example to create a Pod using Curl to reach out the metrics:
kubectl run curl --restart=Never -n <namespace-name> --image=curlimages/curl:7.78.0 -- /bin/sh -c "curl -v http://<my-project>-controller-manager-metrics-service.<my-project-system>.svc.cluster.local:8080/metrics"
Publishing Additional Metrics
If you wish to publish additional metrics from your controllers, this
can be easily achieved by using the global registry from
controller-runtime/pkg/metrics.
One way to achieve this is to declare your collectors as global variables and then register them using init() in the controller’s package.
For example:
import (
    "github.com/prometheus/client_golang/prometheus"
    "sigs.k8s.io/controller-runtime/pkg/metrics"
)

var (
    goobers = prometheus.NewCounter(
        prometheus.CounterOpts{
            Name: "goobers_total",
            Help: "Number of goobers proccessed",
        },
    )
    gooberFailures = prometheus.NewCounter(
        prometheus.CounterOpts{
            Name: "goober_failures_total",
            Help: "Number of failed goobers",
        },
    )
)

func init() {
    // Register custom metrics with the global prometheus registry
    metrics.Registry.MustRegister(goobers, gooberFailures)
}
You may then record metrics to those collectors from any part of your reconcile loop. These metrics can be evaluated from anywhere in the operator code.
Those metrics will be available for prometheus or other openmetrics systems to scrape.
